What is business intelligence & why should legal teams care?

What is business intelligence? It involves leveraging tools to turn data and analytics into actionable insights that facilitate more strategic business decisions.
If that sounds like a bunch of jargon, let us paint you a picture.
You’ve leveraged technology to collect data on the break down costs by matter, timekeeper level, and task codes. File folders are full of reports that show spend by matter, time to process invoices, and notes on vendor performance. You are swimming in data.
But gathering that information is just the first step. What’s really important is what you do with it once you have it. Without the proper tools or training, manipulating data to uncover business insights can be difficult.
Despite its reputation of being yet another buzzword, business intelligence can be incredibly helpful when applied practically. For legal teams, that could mean organizing data in a way that helps you determine which vendor to use for a new matter or predict what spend will be over the next quarter.
So, what is business intelligence for legal departments? It’s a way to turn endless rows of data into an analysis you can actually use.
Business Intelligence Puts Your Data into a Useful Context
You might have all the information you need to make better staffing decisions, cut back on spending, and run a more efficient department. But data is meaningless if you can’t put it into perspective. Business intelligence isn’t just about gathering and storing data; it’s also about viewing, analyzing, and leveraging data so you can improve your operations.
Business intelligence tools help you build visual reports that show you the bigger picture. So, instead of scrolling through a spreadsheet with timekeeper rates and invoices for each vendor, you can easily compare them side by side with graphs.
Spreadsheets often require a combination of pivot tables, functions, and formulas in order to interpret data. Business intelligence tools such as Tableau turn the data into visualizations that are easier to look at and analyze. Take a look at one way our new advanced reporting powered by Tableau presents SimpleLegal data:
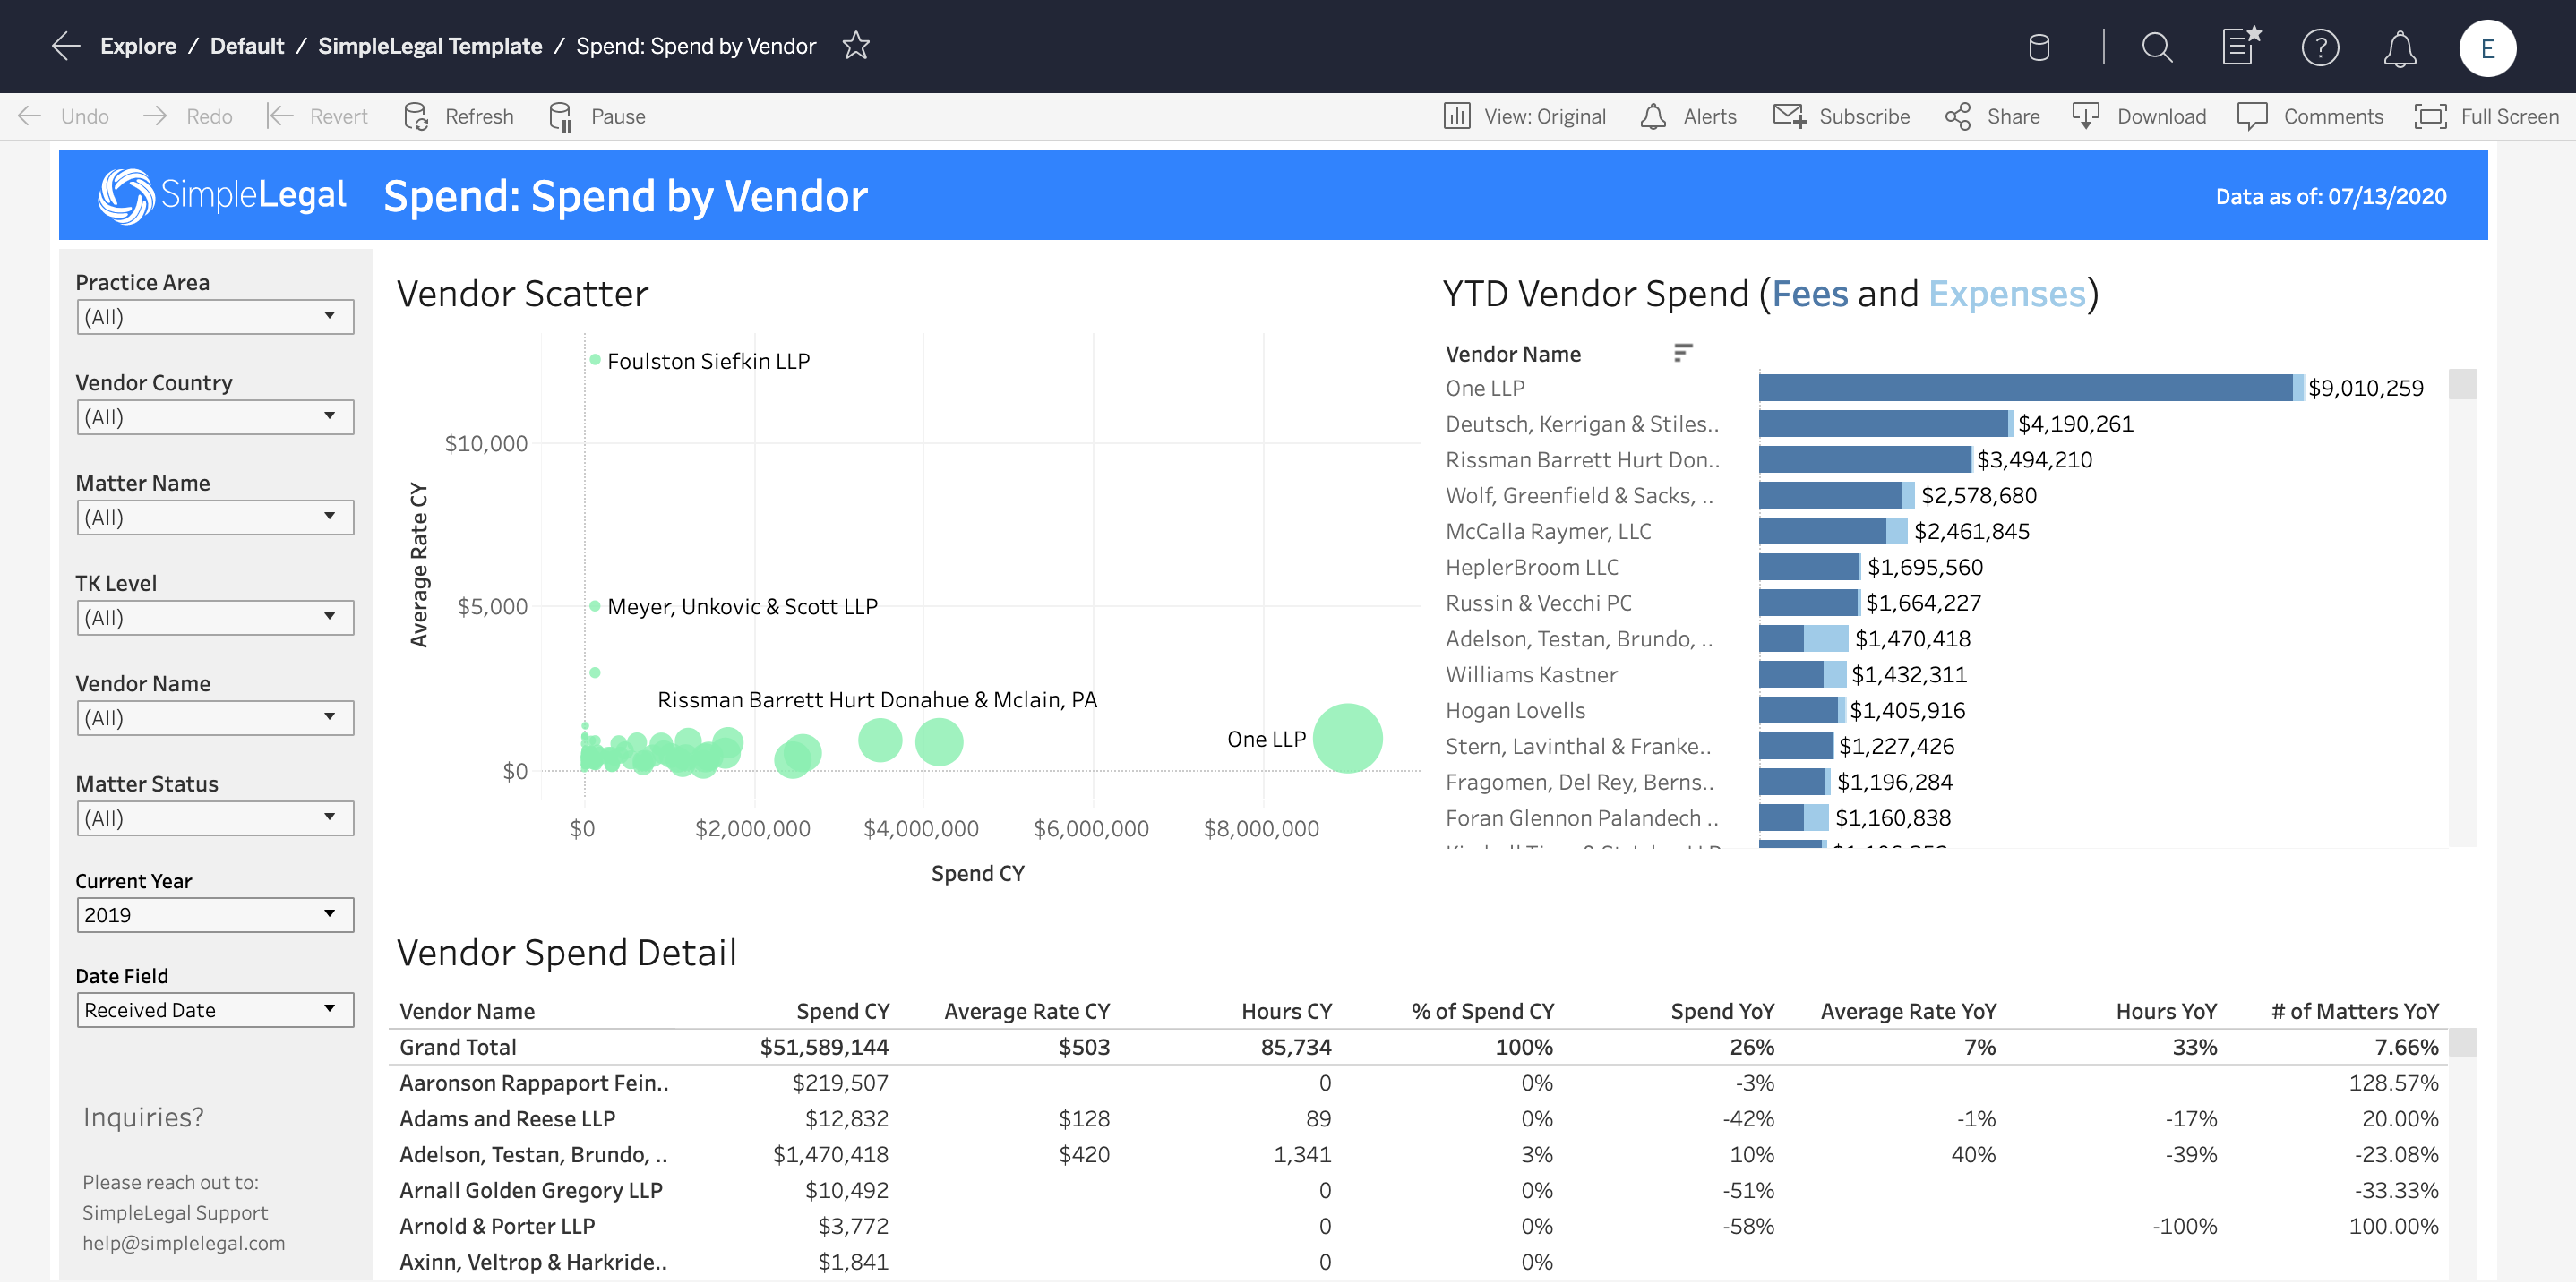
This spend-by-vendor report shows that external vendor Adelson, Testan, and Brundo has an overall spend that is similar to that of Williams Kastner. However, the color-coded bar graph makes it clear that Williams Kastner submits significantly fewer expenses.
But that’s just one example. With the SimpleLegal Tableau add-on, there are several ways you can use data to make more strategic business decisions.
Analyze Outliers and Areas of Concern
Identifying anomalies is useful, but business intelligence tools take it a step further by helping you find explanations.
Visualizations make it easier to spot and investigate outliers. For example, the graph below clearly separates good, OK, and bad shipping times. If you pull up this data in Tableau, you can click through various data points to dig into the specifics.
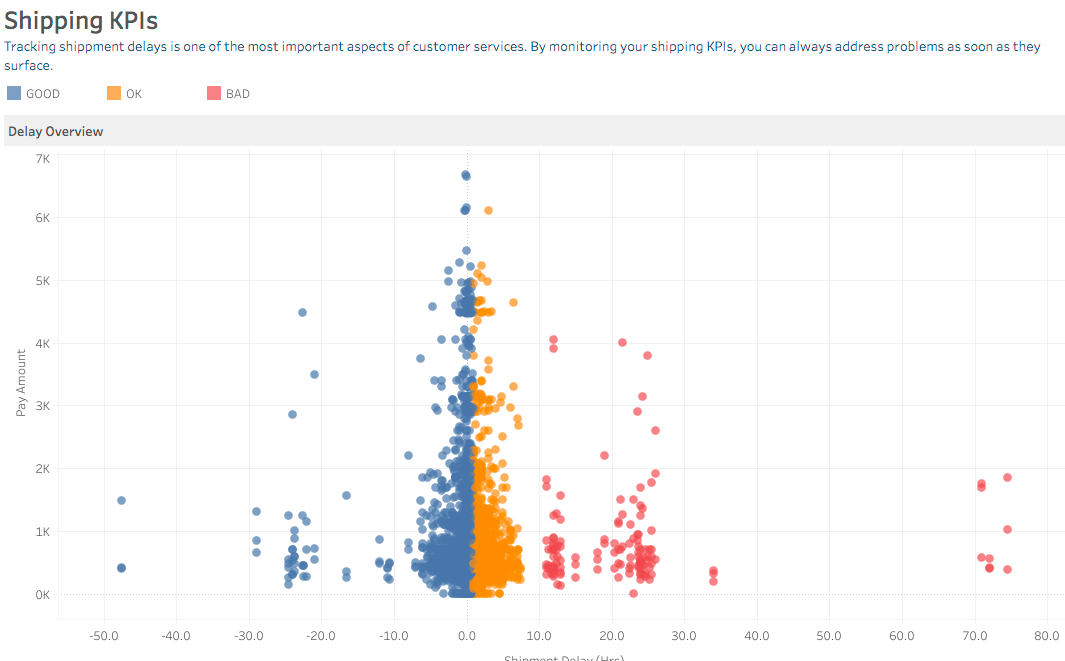
Your legal team probably doesn’t need to evaluate shipping delays, but consider a similar graph that shows how long each law firm takes to submit invoices or your team’s overall satisfaction with each vendor. A spend-by-task-code report, for instance, could quickly reveal that many of your invoices do not include UTBMS task codes at all.
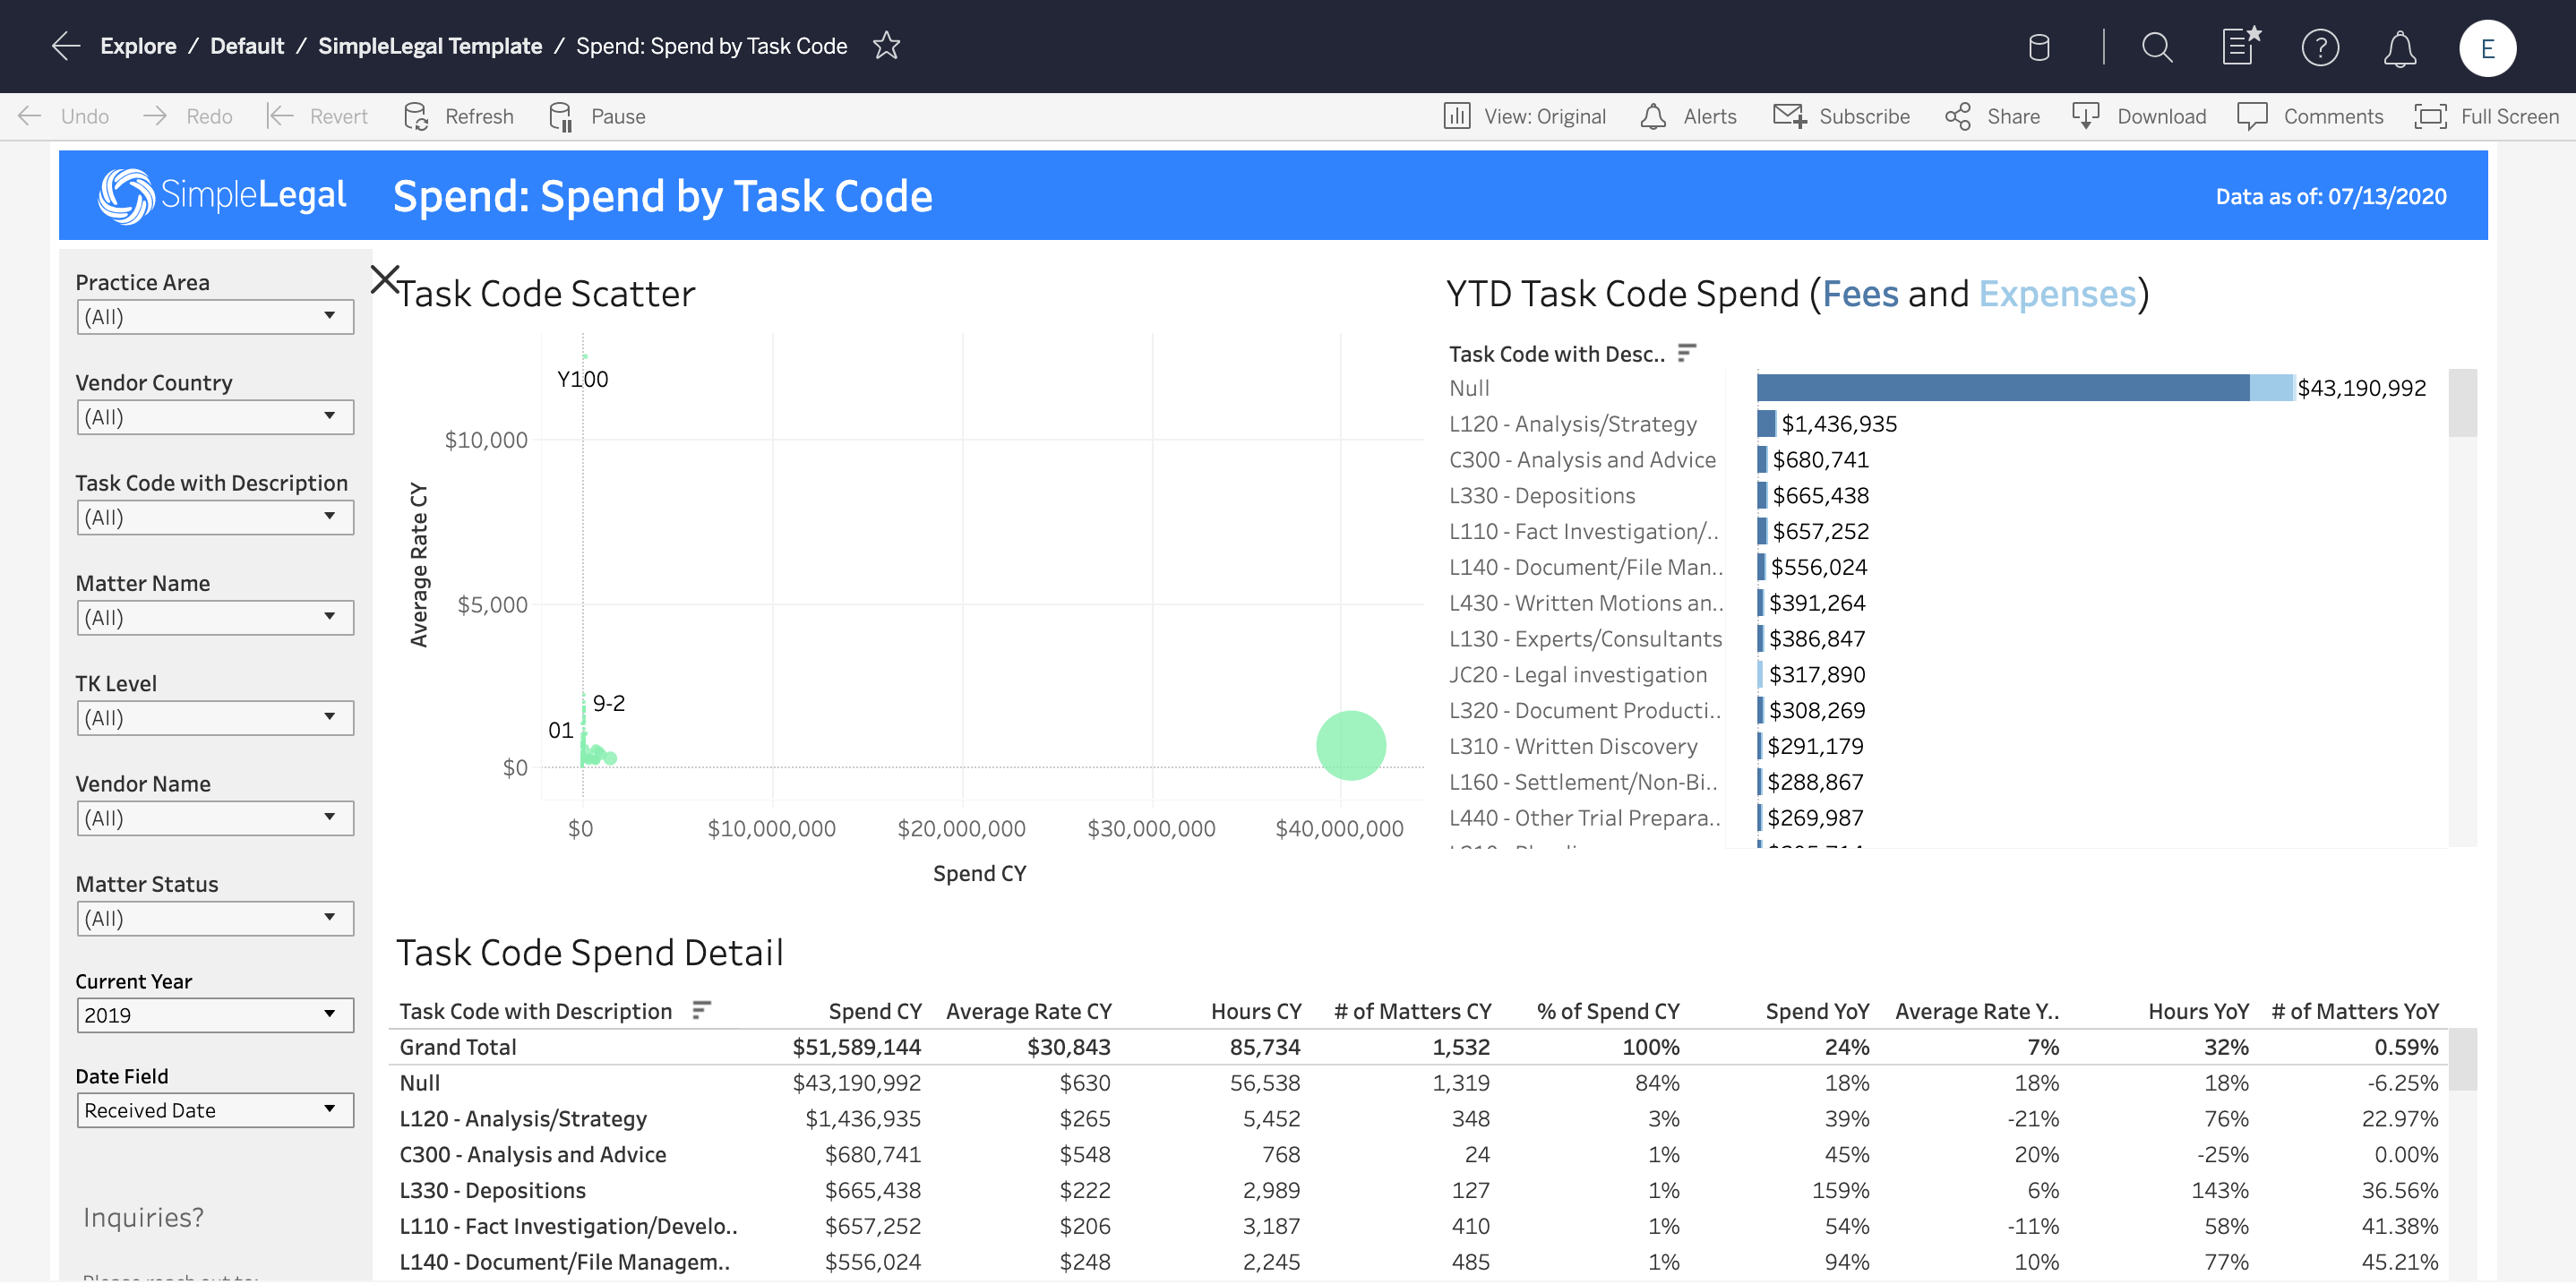
With this report, you can quickly infer that a large portion of your invoices are not LEDES files. From there, you can determine which firms are responsible and ensure that future invoices categorize costs.
Evaluate Outside Law Firm Performance
When you work with multiple outside firms, potential issues may slip under your radar. With SimpleLegal’s business intelligence features, you can get a more complete view of all vendor performance.
If you use vendor scorecards to evaluate the firms you work with, you can plug that data into the Tableau integration to view vendor ratings all in one place. Then, toggle between views to look into different performance metrics, such as time to invoice, actual speed versus predicted, partner versus associate billing, and more.
When vendor analysis is only a few clicks away, you’ll be prepared to make data-driven decisions about vendors at any time. You can also use the information to renegotiate contracts or create preferred panels staffed with your top-performing vendors.
Forecast Spend for Future Projects
With business intelligence tools, there’s no need to review every matter type or law firm individually. Visual reports provide an overview of all spend and then allow you to drill down into the details. Armed with deeper insights, your team can predict budget needs for future matters.
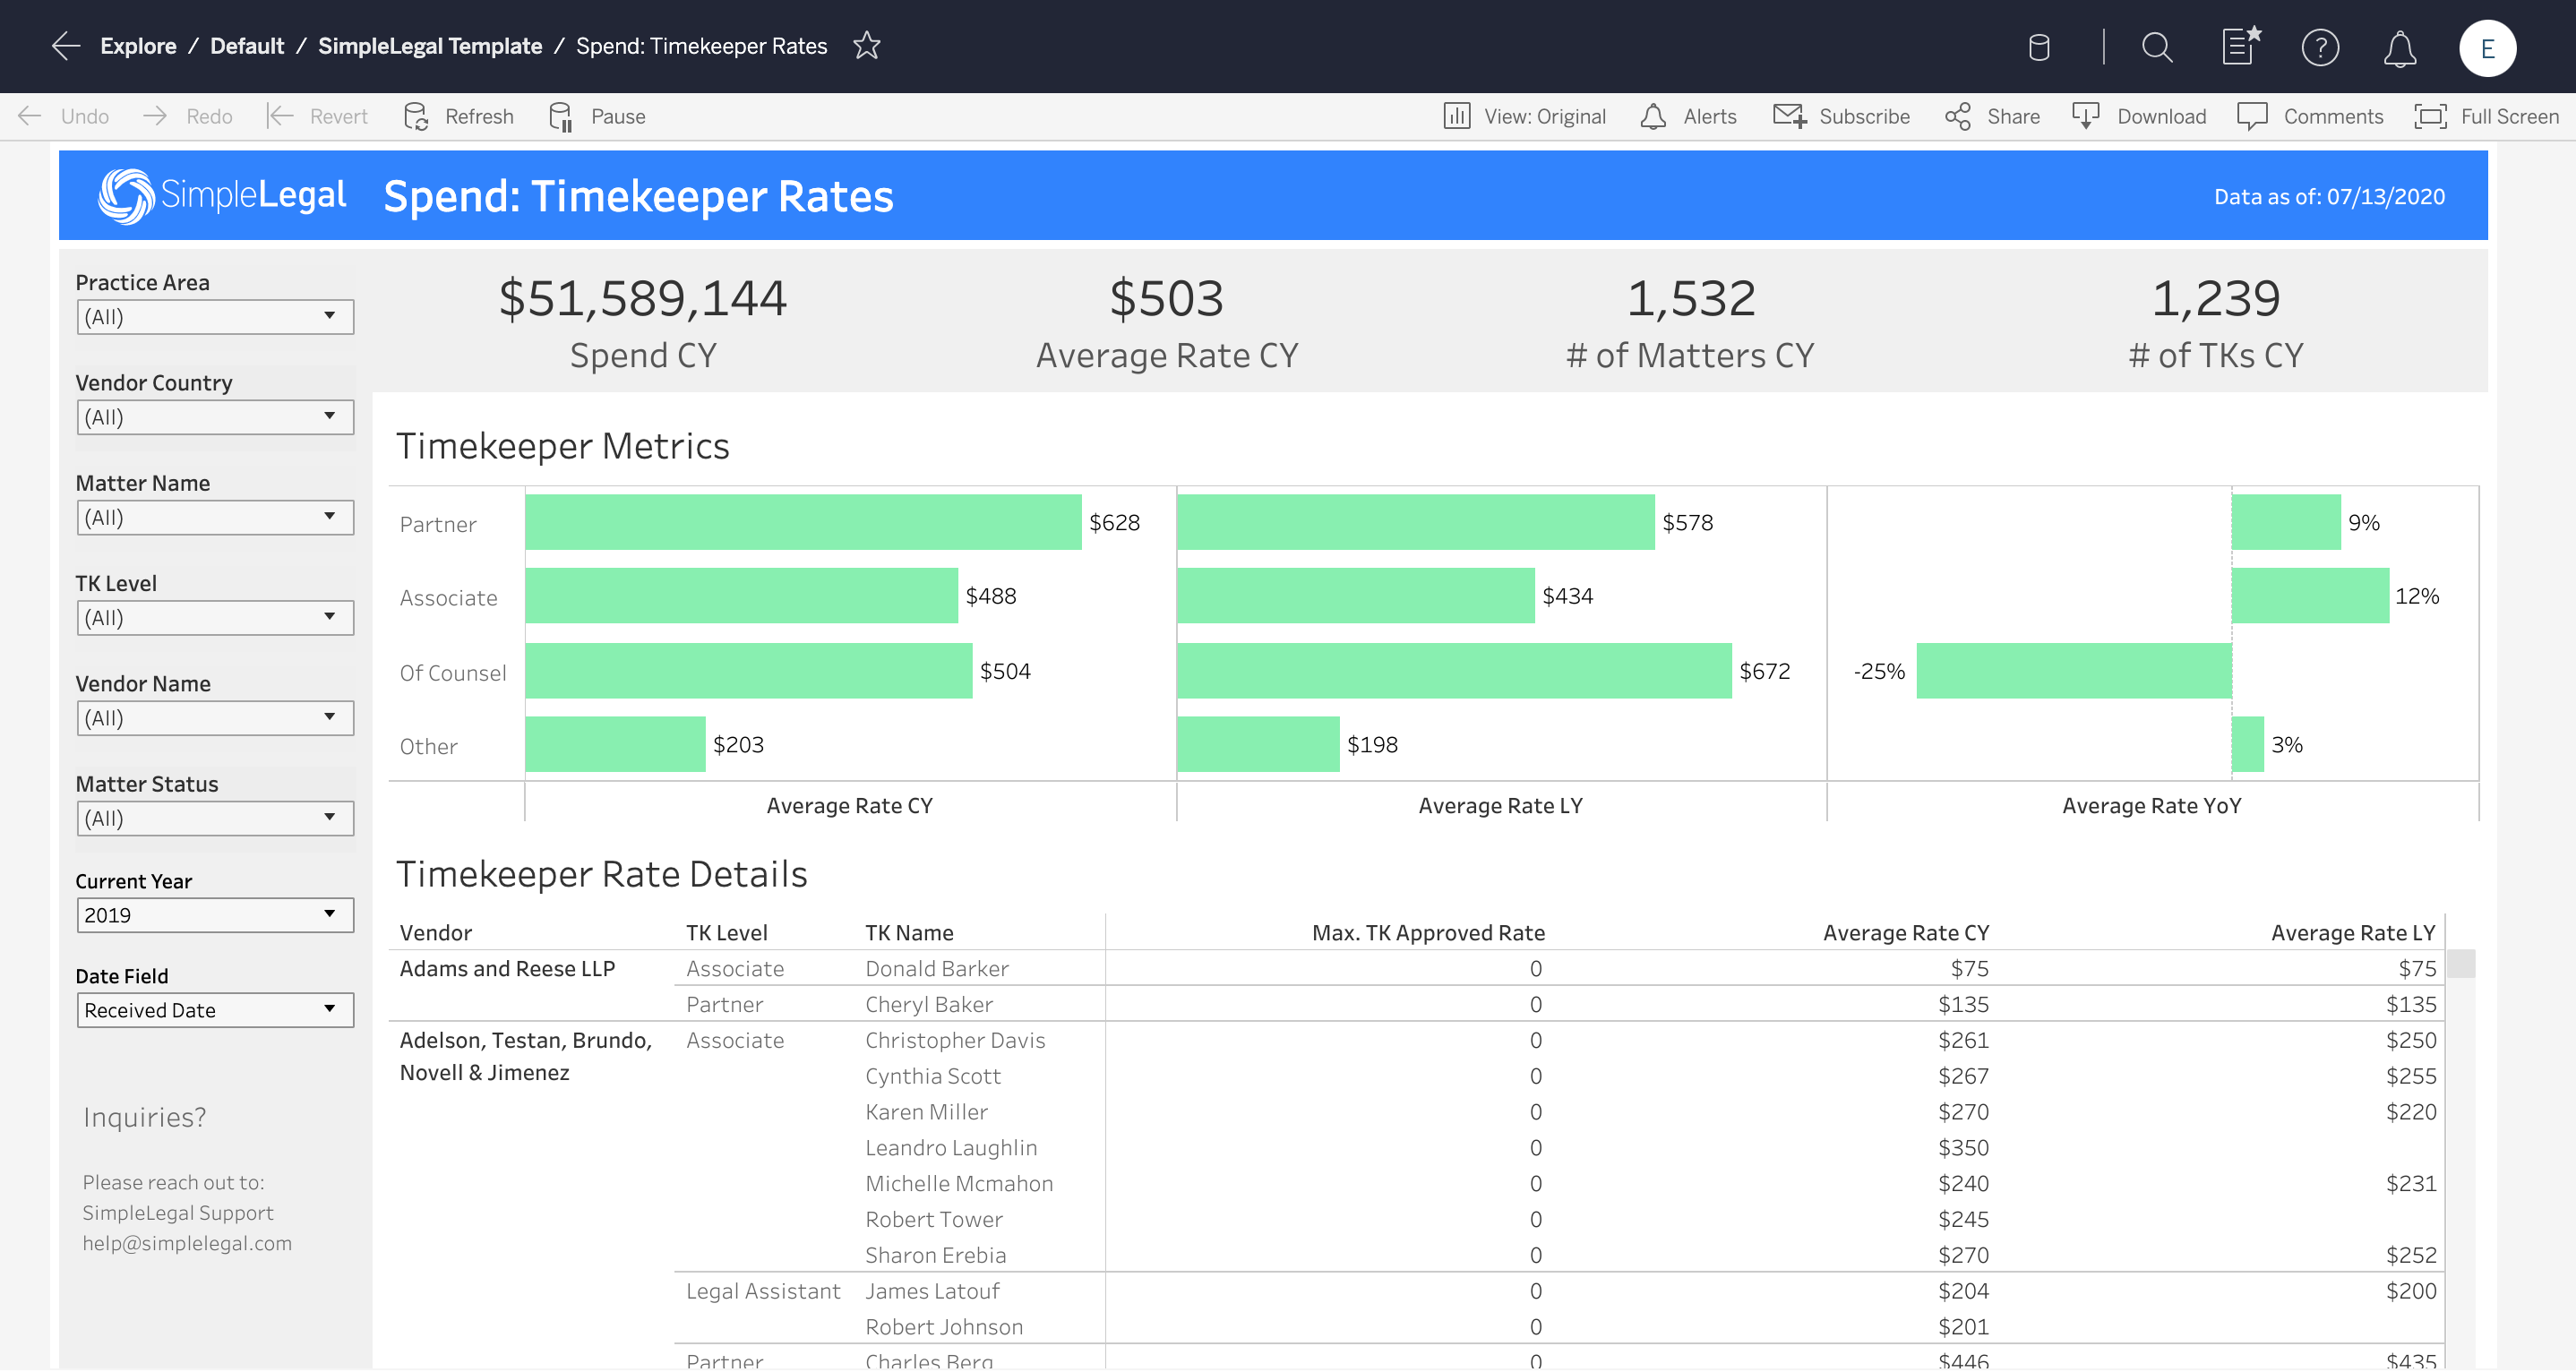
Our Tableau add-on lets you filter spend by several aspects, such as average timekeeper rate, number of matters, or timekeeper level, and then extrapolate from there.
Let’s say you currently have 1,532 matters and plan to add 500 more in the next quarter. Current data will show your average spend for each metric. Business intelligence analytics help turn those insights into a data-backed estimate for future budget needs.
Without business intelligence tools, you might base your estimate on a basic math problem: average cost of each matter times 500 equals additional budget needs. But that’s an oversimplified estimate. Business intelligence simplifies the process of digging into specific variables, such as averages by matter type, timekeeper level, and task codes. Drilling down into these details leads to more accurate estimates.
With SimpleLegal, you can even schedule reports to run and then have them sent directly to your inbox so you won’t need to log in to the platform at all. Plus, you can authorize users to subscribe to reports so they can receive regular updates as well.
What Is Business Intelligence? The Key to a More Efficient Legal Department
It’s time to ditch the complicated spreadsheets. With SimpleLegal’s Tableau integration, you can automatically track key metrics and then convert raw data into easy-to-understand formats, like visual graphs, dashboards, and worksheets.
Sign up for a demo to see how you can leverage business intelligence to make data-driven decisions for your legal department.